

A combination of youngstock shortages and increased culling rates could potentially cause an imbalance in the number of milking females in some dairy herds and, as a result, overall herd production, according to a new report.
“One of the observations of the AHDB Milk Forecasting Forum earlier this year, was that national milk production from January 2018 to April 2019 would be adversely affected due to historic insemination decisions to use more semen from beef sires, made during times of lower milk prices, and we're now seeing the full impacts of this in terms of youngstock numbers coming into the national herd,” said Nigel Davies, Promar’s national consultancy manager.
“What’s more, when set against the trend of a higher rolling 12-month culling rate that we’ve seen in the most recent Milkminder sample, this raises the question as to whether some herds will be able to maintain the growth in herd size that they’ve recently achieved, or even maintain their existing herd size over the next 12 months.”
The March 2018 Milkminder matched dataset indicates that over the last 12 months, the average stay of each animal in the herd has fallen by 68 days, when compared to March 2017, to just over three years and seven months.
To further emphasise this, while recognising that the impact of disease and compulsory culling for some individual businesses has been severe, Mr Davies said recent budget work with some of the business' less affected clients, indicates that the outcome could also be significant for them, with a likely imbalance between the expected number of animals leaving and joining the herd.
As a result, he advised affected herds to investigate and understand why additional culls were made over the last 12 months.
“With the aid of tools such as Milkminder, drilling down and mapping out the reason as to why each individual cow left the herd can be very revealing and help inform and develop effective plans to reduce future losses.
“The other part of the equation of course is having a clearly defined and consistent breeding policy that ensures a reliable flow of sufficient future replacements,” concluded Mr Davies.
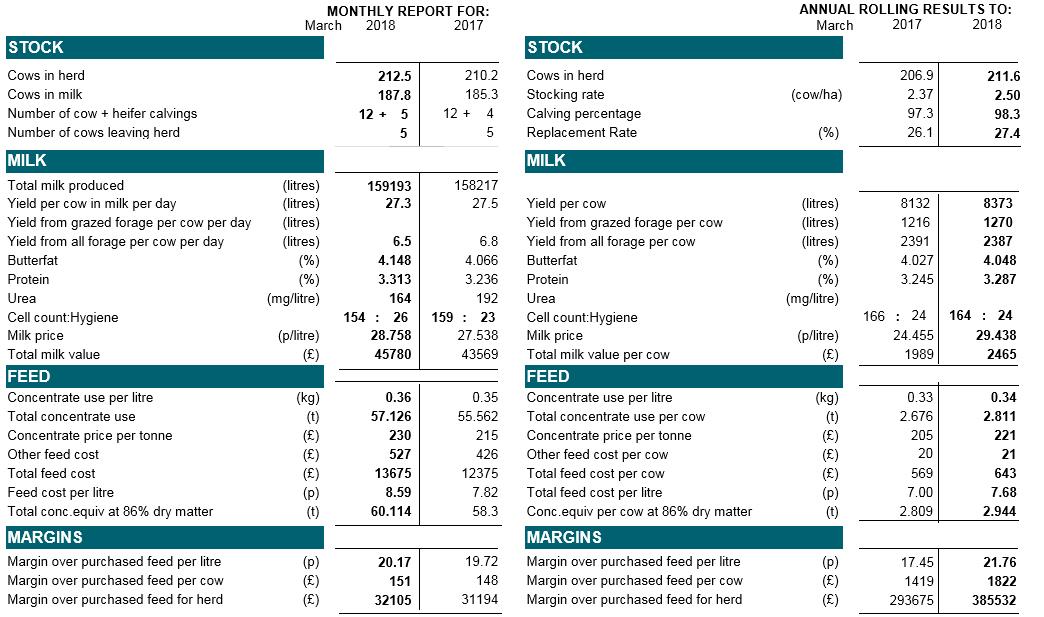
Promar monthly report
Stock March 2018 2017
Cows in herd 212.5 210.2
Cows in milk 187.8 185.3
No of cow + heifer calvings 12+5 12+4
No of cows leaving herd 5 5
Milk
Total milk produced (l) 159,193 158,217
Yield/cow/day (l) 27.3 27.5
Yield from all forage/cow/day 6.5 6.8
Butterfat (%) 4.148 4.066
Protein (%) 3.313 3.236
Urea (mg/l) 164 192
Cell count:hygiene 154:26 159:23
Milk price (p/l) 28.758 27.538
Total milk value (3) 45,700 43,569
Feed
Concentrate use per litre (kg) 0.36 0.35
Total concentrate use (t) 57.126 55.562
Concentrate price/t (£) 230 215
Other feed cost (£) 527 426
Total feed cost (£) 13,673 12,375
Feed cost/l (p) 8.59 7.82
Total conc.equiv at 86% DM (t) 60.114 58.3
Margins
Margin over purchased feed/l (p) 20.17 19.72
Margin over purchased feed/cow (£) 151 148
Margin over purchased feed for herd (£) 32,105 31,194
Annual rolling results
Stock March 2017 2018
Cows in herd 206.9 211.6
Stocking rate (cow/ha) 2.37 2.50
Calving percentage 97.3 98.3
Replacement rate (%) 26.1 27.4
Milk
Yield per cow (l) 8132 8373
Yield from grazed forage/cow (l) 1216 1270
Yield from all forage/cow (l) 2391 2387
Butterfat (%) 4.027 4.048
Protein (%) 3.245 3.287
Cell count:hygiene 166:24 164:24
Milk price (p/l) 24.455 29.438
Total milk value/cow (£) 1989 2465
Feed
Concentrate use/l (kg) 0.33 0.34
Total concentrate use/cow (t) 2.676 2.811
Concentrate price/t (£) 205 221
Other feed cost per cow (£) 20 21
Total feed cost per cow (£) 569 643
Total feed cost per litre (p) 7.00 7.68
Conc.equiv per cow at 86% DM (t) 2.809 2.944
Margins
Margins over purchased feed/litre (p) 17.45 21.76
Margin over purchased feed/cow (£) 1419 1822
Margin over purchased feed/herd (£) 293,675 385,532


Comments: Our rules
We want our comments to be a lively and valuable part of our community - a place where readers can debate and engage with the most important local issues. The ability to comment on our stories is a privilege, not a right, however, and that privilege may be withdrawn if it is abused or misused.
Please report any comments that break our rules.
Read the rules here