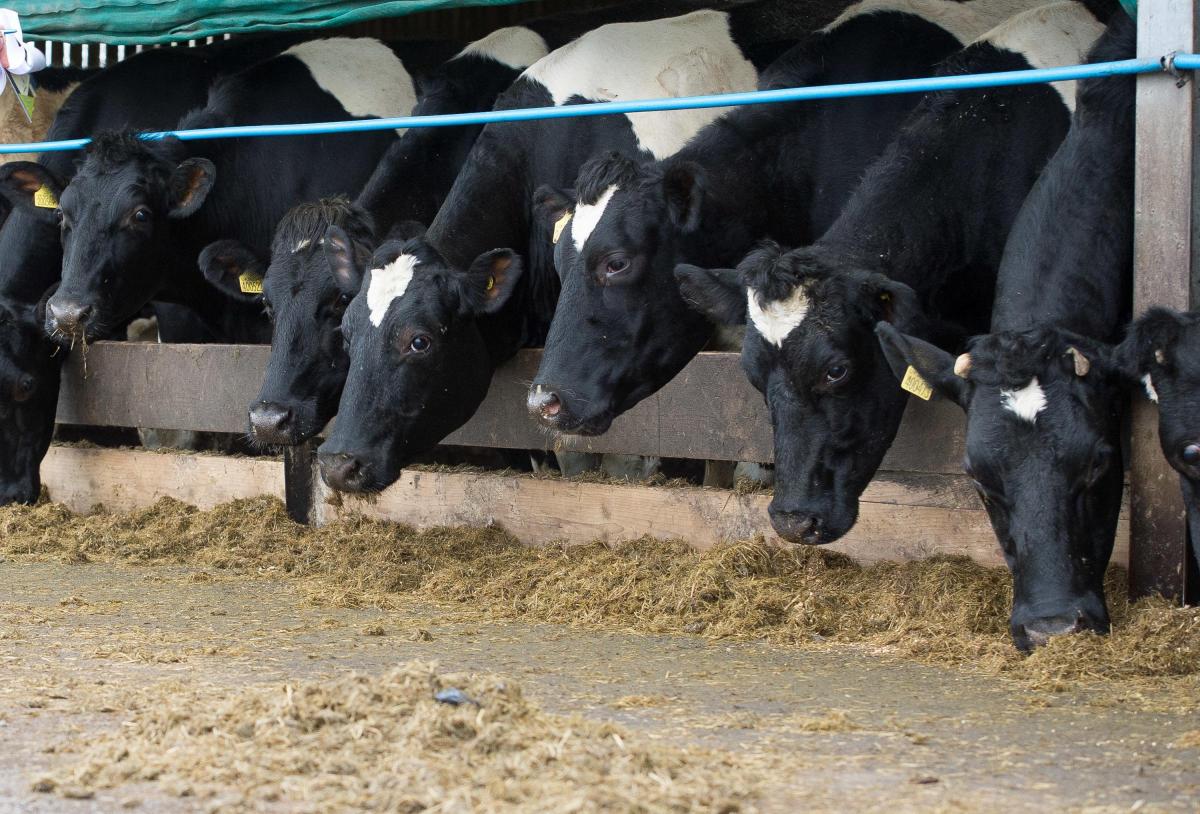
An early spring coupled with ideal grass growing conditions all year should ensure an easier winer for many dairy farmers with better quality silage and increased stocks pointing towards reduced feed costs and improved production from forage.
That is the welcoming news from Dr Liz Homer, ruminant technical development manager at Trouw Nutrition GB which operates one of the UK’s largest feed and forage analysis laboratories.
Going by the results of 4500 first cut grass samples, 1000 second cuts, and more than 500 wholecrop samples analysed so far this year, she said the prospects for the coming winter are more encouraging than for several years.
“Good weather and the adoption of multi-cut systems by many farmers mean that stocks are generally higher and the quality is looking very good. Together these should allow higher forage intakes, improved rumen performance and the potential to reduce purchased feed costs per litre," said Dr Homer.
“The high quality seen in the early first cuts has continued into later cuts (see table). Grass silage is generally drier with good energy and protein contents while wholecrop has a higher starch content but overall slightly depressed energy levels.”
She added that while silages are generally analysing better, there is a range in the results meaning it is essential farmers get their own clamps analysed regularly. Then the priority must be to understand how the forages will feed and to balance them appropriately.
On average, she said grass silages have higher NDF content than in 2018 although still not extremely high. However, levels of lignin are high.
Furthermore, she warned that higher lignin content makes the fibre less digestible which could lead to reduced rumen passage rates, lower feed intakes and lower production if the diet is not carefully balanced.
“These drier, high lignin silages will be less fermentable with low, rapidly fermentable and total fermentable carbohydrate levels, therefore they need to be balanced with sources of rumen fermentable energy and fermentable protein to improve rumen efficiency," she said.
Energy sources such as molasses and ground cereals will help supply the carbohydrate required while soya and rape will provide the necessary protein.
Although less wholecrop appears to have been made, Dr Homer said that those farmers who made any will find it will balance grass well, providing rapidly fermentable carbohydrate from starch, and maize should do a good job too when it is available.
“Encouragingly, the acid load and fibre index of grass silages suggest that rumen health should not be too much of an issue, meaning cereal levels can be increased without the risk of acidosis, provided farmers avoid feeding cereals in large feeds which could precipitate a pH drop.”
With most farms entering the winter with high stocks, Dr Homer says there should be the opportunity to drive forage intakes. She added that each additional 1kg forage DM/day would allow a reduction of 0.8kgDM from concentrates, helping increase margins.
To maximise intakes, she stressed the need to avoid the TMR or clamps heating, to mix the diet correctly, to push feed up regularly and to optimise total ration dry matter at 45-50%.
“It will also be important to change between clamps and cuts carefully. We are seeing big differences in digestibility between first and second cuts, irrespective of whether first cut was taken early or at a typical time, with later cuts being less digestible. This could lead to reduced intakes when clamps are changed unless diets are modified carefully.
“Our results suggest dairy farmers could be on the brink of a more profitable winter, but the imperative will be to maximise the value in the clamp by balancing diets carefully, targeting higher forage dry matter intakes and having faith in the forage and not over-supplementing diets.”
e
2019 silage averages to September 2019
Early first cut First cut Second cut Wholecrop
Dry matter (%) 34.1 33.3 34.8 37.8
Crude protein (%DM) 15.4 14.6 14.4 8.7
D Value (%) 71.8 70.6 67.6 64.7
ME (MJ/kgDM) 11.5 11.3 10.8 10.1
Starch (%DM) 27.2
NDF (%DM) 45.8 47.4 49.0 45.8
Lignin (g/kgDM) 35.2 36.0 37.7 45.8
Acid load 49.8 48.6 46.3 52.3
Fibre Index 183.8 189.9 197.1 188.8
DyNE (MJ/kgDM) 6.20 6.12 6.00 5.52
Source: TNGB


Comments: Our rules
We want our comments to be a lively and valuable part of our community - a place where readers can debate and engage with the most important local issues. The ability to comment on our stories is a privilege, not a right, however, and that privilege may be withdrawn if it is abused or misused.
Please report any comments that break our rules.
Read the rules here